Set Up and Configuration for Reporting and Metrics Agent
The Reporting and Metrics Agent is a Windows service that securely communicates with the Knowledge Tier. For technical details, including ports and domains that may be needed for firewall rules, refer to the Knowledge Tier Agent Connection URLS documentation.
NOTE: Outgoing firewall policies must allow the service to initiate a connection to onprem.syniti.com:443.
NOTE: To install and configure the Reporting and Metrics Agent, you must have administrative rights on the server where the Reporting and Metrics Agent will be installed.
NOTE: Please open a Support ticket for assistance in presenting Stewardship Tier data in your custom dashboards.
Prerequisites
- Syniti Solutions 7.2.0 or later must be installed.
- Outbound traffic the following domain must be permitted so that the Reporting and Metrics Agent can communicate with the cloud:
onprem.syniti.com:443
agent.virtyx.com:443
realtime.virtyx.com:443
NOTE: The standard deployment configuration requires the Reporting and Metrics Agent to be installed on the same server as Syniti Solutions. For alternative configurations please contact Syniti Support for assistance.
System Requirements for the Reporting and Metrics Agent
- Windows Server 2019
- Windows Server 2016
Link Syniti Solutions Instance to Knowledge Tier Tenant
The Reporting and Metrics Agent transfers reporting-relevant data from the Syniti Solutions to the Knowledge Tier. This agent is installed with the Syniti Solutions, which allows the dashboard to be accessed through the Knowledge Tier.
To link the Syniti Solutions instance to the Knowledge Tier tenant:
Create the Knowledge Tier Reporting Site
To create the Knowledge Tier reporting site:
-
Click the Sites icon in the Guidance panel.
-
Click the Add Site icon.
-
Select Reporting and Metrics from the Purpose list box.
-
Enter a name for the site in the Name field.
-
Enter the login name for the Stewardship Tier Administrator SQL User in the Username field.
-
Enter the password of the login for the Stewardship Tier Administrator SQL User in the Password field.
-
Enter the hostname or IP address of your server in the Hostname field.
-
Enter the port for your server in the Port field (MS SQL Server default port is 1433).
-
Enter the name of the database to which you want to connect in the Instance field. Leave this field blank if not applicable
NOTE: The connection information is the same information that the Stewardship Tier WebApp is configured to use for connecting to the database. This address is relative to the Stewardship Tier WebApp server because in most cases, the Stewardship Tier database is only exposed to a local network. The address could be an internal hostname or an RFC 1918 address so long as the Stewardship Tier WebApp machine can resolve the name and connect to it.
NOTE: The Stewardship Tier database may or may not be on the same machine as the Stewardship Tier WebApp, which is where the Reporting and Metrics Agent runs to collect the data.
NOTE: The Connection URL field automatically populates with the connection information you provide in the credentials fields. If you need to customize the URL or have been provided an agent connection URL by your database administrator, paste the URL directly into the Connection URL field. It’s important that the URL entered is encoded to ensure that unprintable characters or characters with special meaning are translated to values that are unambiguous and universally accepted by web browsers and servers.
- Copy and save the contents of the Config File Field to a text file.
NOTE: The Config File will disappear once you navigate away from the page, so be sure to save it somewhere secure first.
-
Click Save to save your connection and hide your credentials.
NOTE: The contents of the Connection URL in the Config File are used to link the Stewardship Tier to the Knowledge Tier tenant.
-
Click the Use as a source for migration dashboard toggle to enable the site to be used as a source for the migration dashboard. Refer to Enable/Disable the Migration Metrics plugin for more information.
NOTE: When the site is disabled as a source for a migration dashboard, all data associated with the site will be deleted from the dashboard and cannot be retrieved again.
Update the Reporting and Metric Agent Configuration
To update the Reporting and Metric Agent configuration:
- Copy the contents of the Config File field in the Knowledge Tier.
- Create a new text document and name it “config.json.” Make sure the file extension is “.json” and not “.txt.”
- Paste the text from the Config File field into the new config.json file.
- Move the config.json file to the C:\Windows\system32 \config\systemprofile\AppData\Virtyx\.virtyx folder on the Syniti Solutions application server. This folder was automatically created during the Stewardship Tier installation.
NOTE: This /.virtyx folder starts out empty. After starting the service, several .exe files are created in the folder automatically by the service.
Add a Firewall Exception for the Reporting and Metrics Agent
Before the Reporting and Metrics Agent service can be started, the folder that contains the config.json file must be whitelisted.
NOTE: These steps are based on using Windows Defender and may vary depending on the version of Windows.
To add the Reporting and Metrics Agent folder as an excluded folder:
- Copy the following folder path: C:\Windows\system32\config\systemprofile\AppData\Virtyx\.virtyx
-
Open Windows Defender and select Settings.
OR
Select Start > Settings > Update & Security > Windows Security > Virus & threat protection in the Windows menu; the Windows Security menu opens. Under the Virus & threat protection settings heading, click the Manage settings link.
- Under the Exclusions heading, click the Add or remove exclusions link.
- Click the Add an Exclusion button and select the Folder option from the menu that displays.
- Paste the folder path into the search bar and click Enter to navigate to the folder.
- Click the Exclude this Folder button.
Start the Reporting and Metrics Agent Windows Service and Confirm the Site's Status
The Reporting and Metrics Agent, which internally is called the “Virtyx Agent,” is installed with the Syniti Solutions. It will not be running upon installation; it needs the config.json file to start communicating with the Knowledge Tier. This service runs every 30 minutes.
To start the Reporting and Metrics Agent windows service:
- Open Windows Start Menu.
- Perform a search on “Services” and open the Services application from the results.
- Locate Virtyx Agent in the Services application.
- Right-click Virtyx Agent.
- Select Start.
To confirm the site’s status, log in to the Knowledge Tier and confirm the site’s status is “Last Upload Successful.”
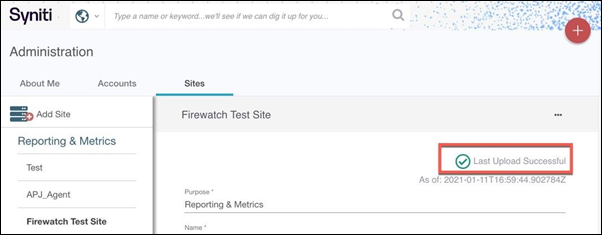
If this message does not display, consult the View agent error logs documentation in the Knowledge Tier help.
If you click the … icon, error messages returned from the agent in the last 48 hours display.